 |
kbLogger 2.0.b1
The automotive ready test and logging program.
|
 |
kbLogger 2.0.b1
The automotive ready test and logging program.
|
Description:
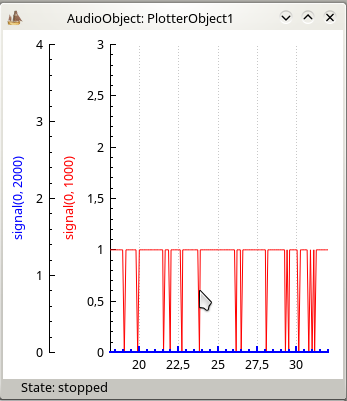
The PlotterObject is used for displaying the content of numerical variables which are embedded in the payload or meta data of arrived messages. The variables are displayed in a the plotter window. For every variable which shall be displayed, one row in the variables table in the configuration dialog must be configured.

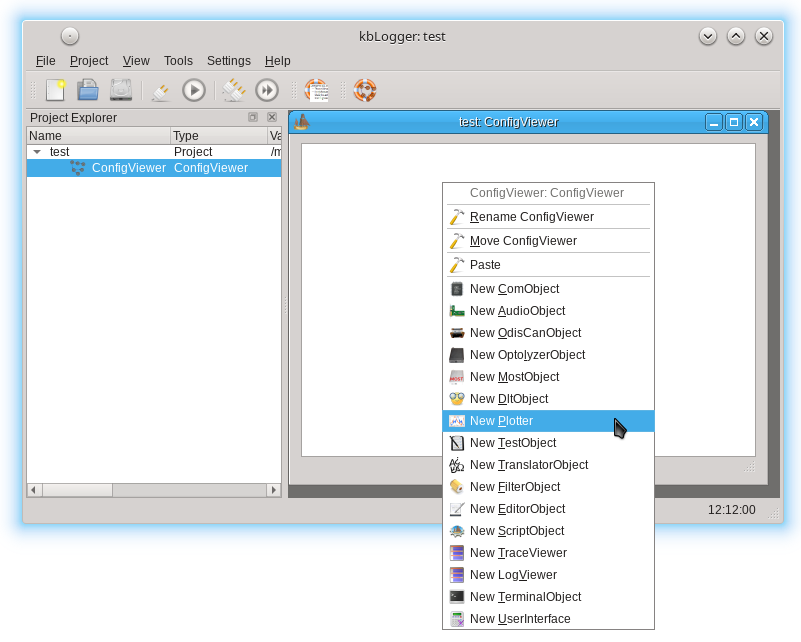
Do a right-click on an empty place in the ConfigViewer of your project and choose "New Plotter".

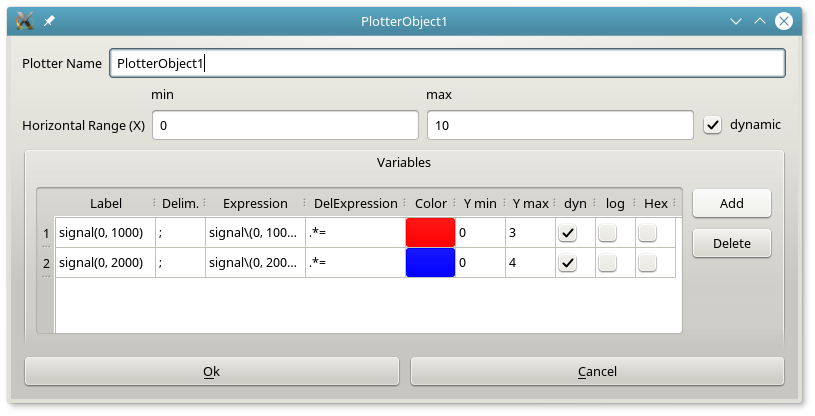
Double click on the Plotter to open the configure dialog.

Plotter Name:
The edit field "Plotter Name" contains at first a generic name like "Plotter1". This user changeable name is used to identify the ConfigItem in the TraceViewer or LogViewer. This name can also be used as sender or receiver name for massages.
Horizontal Range (X):
In the 2 edit files, you can configure the lower and upper range of the X axis. If the check box "dynamic" is not checked, the given range is fixed. That means, the graphs are not moving with the time, but can be moved by the mouse.
Add a variable:
Click on the Add button to add an empty line to the variable table.
Delete a variable:
Select a line in the variable table and click on the Delete button afterwards to remove the selected variable definition.
If you want to change a variable definition, double click into that property cell which you want to change.
Label:
Here you can configure a custom string which will be displayed together with the related Y axis.
Delim. (Delimiter):
Here you can configure a custom delimiter character which will be used to split the arrived messages into multiple "variables".
Expression:
This is a regular expression. Every part of the received messages is test against the expression of every configured variable. The matched text is reduced by the next "DelExpression".
DelExpression:
The delete regular expression is used to delete that parts of the matched test, which are not convertible into a numerical format. The resulting string is used as Y value to plot.
Color:
Double clicking in this cell opens a color chooser dialog. The choosed color is used for that variable.
Y min:
The lower range of that graph.
Y max:
The upper range of that graph.
dyn:
The checked dynamic check box causes the range to be rescaled to show the complete graph in the Y direction.
log:
The checked logarithmic check box caused the related Y axis to uses a logarithmic scale.
Hex:
The checked Hex check box caused the extracted value to be interpreted as Hex coded and converted to a decimal value before it is plotted.
signed:
In case of Hex values, the the can contain negative values as 2-complement. For example "FFFF" gives -1.
Bytes:
In case of Hex values, you can set the width of the number to 1, 2, 4 or 8 bytes. This influences the results of the signed conversion above.